


ARTICLES
A brief history of US recessions
Over the past 50 years there have been six recessions in the United States, not including the recent COVID-19 »recession«, and I'm placing that between quotation marks because in my view it really wasn't a recession as I'll explain later. Each recession is unique in its own way. In 1973 the oil crisis, a quadrupling of oil prices by OPEC, coupled with the 1973-1974 stock market crash led to a stagflation recession in the United States. In the early eighties, a double recession began as the Federal Reserve raised interest rates dramatically to fight the inflation of the 1970s which spiked after the 1979 Iranian Revolution again caused a spike in oil prices. The early nineties economy again was hit by high inflation and the FED responding by raising the interest rates, with the US economy being pushed into a short recession when Iraq invaded Kuwait. After a steady period of growth during the nineties, the collapse of the speculative dot-com bubble occured which, combined with the September 11th attacks, led to yet another short recession. And most recently there was the subprime mortgage crisis between 2007 and 2009, where falling housing-related assets contributed to a global financial crisis and the collapse of multiple large US banks and bailout of car manufacturers.
While each situation was different, recessions also have something in common: they all occur during the contraction stage of the economic cycle. The economic cycle refers to fluctuations of the economy between periods of expansion (growth) and contraction (recession).
During the expansion phase, the economy experiences growth, interest rates tend to be low, and production, consumer demand and corporate profits increase. Unemployment drops and wages increase. However, the increase in the money supply causes inflation to pick up, causing the central bank to raise the interest rate to prevent inflation from getting out of hand and making it more expensive to borrow money. By doing so, the central bank effectively steps on the brake of economic growth. The economy reaches the peak of a cycle when growth hits its maximum rate. Prices and economic indicators may stabilize for a short period before reversing to the downside. A contraction occurs when consumer demand slows, unemployment increases, and corporate profits drop. Markets become oversaturated with surplus supply, pushing prices lower, and consequently the central bank lowers the interest rate again, encouraging investment and economic growth. Finally, the trough of the cycle is reached when the economy hits a low point before growth eventually begins to recover.
Each of the afore-mentioned recessions were preceeded with rising inflation, rising interest rates, growing unemployment and eventually negative GDP growth. In fact, historically first the interest rate or inflation spikes (one or the other occurs first, depending on central banking policy), then GDP contracts while both the interest rate and inflation are already in decline, and lastly unemployment maxes out. Unemployment spikes last because companies take time to hire again when the economy initiates a new period of recovery, so for many people it may feel that a recession is still ongoing even though the economy is already back in expansion stage.
The COVID »recession« was not a recession
During the first and second quarter of 2020, US quarterly GDP (annualized) contracted by 4,60% and an astonishing 29,90% respectively. In theory, when an economy endures two consecutive quarters of negative GDP growth, it is considered a recession. However, given the reason for that contraction in early 2020, it is clear that it was not part of the normal economic cycle. It was a contraction caused by the mandatory shut-down of businesses which, once the restrictions were lifted, continued operations as usual. Prior to the lock downs, inflation stood at 2,30%, just slightly above the FED's target rate of 2%, and the FED interest rate stood at just 1,25%. The unemployment was in decline and stood at only 3,50%, the lowest level since 1969. The US economy was effectively still in expansion phase of the economic cycle when the lockdowns were enacted.
The impact of the lockdowns, which started in late March 2020, was immediate. The unemployment rate jumped from 3,50% in February to 4,40% and then made the largest jump in recorded history to 14,70% in April, the highest rate since the Great Depression. However, as businesses started reopening, the unemployment rate tumbled again to 8,4% by August 2020 and to 4% by late 2021 until eventually it reached as low as 3,4% in January of this year. This was remarkable fast, especially considering that the restrictions were lifted only gradually, that the vaccine became available only in early 2021 and that multiple new COVID variations hampered reopenings.
The Federal Reserve never declared the COVID crisis as a recession, largely because of the strong labor market. Besides, if it were a true recession, then it would take much longer for the labor market to recover. For example after the subprime mortgage crisis of 2007-2009, it took over a decade for the unemployment rate to drop from its peak in November 2009 at 9,9% to its 3,50% low in February 2020. And after the relatively mild Dot.com recession, it took over 3 years to drop just 1,8 percentage points. The COVID »recession« caused a massive shock in the labour market and two quarters of negative GDP growth, but it was not a recession by any stretch. However…
…the COVID crisis triggered the upcoming recession
By the time vaccinations became available worldwide and governments began lifting the lockdown restrictions, people were eager to go out and spend their savings, having been unable to do so for nearly a whole year. In April 2020 the US personal savings rate jumped to a record 33,8% because people had basically nowhere to spend their income and the savings rate remained elevated for a whole year and a half. In addition the US government paid out multiple stimulus checks for families to cope with the unemployment shock, so people were sitting on large savings accounts and couldn't wait to go out shopping again. The cherry on top was that the FED's interest rate still stood at 0,25%, so it was very cheap to buy on credit also. Consumer spending soared throughout 2021 and production could not keep up with demand. Businesses and plants had just recently reopened and had difficulties hiring new employees – COVID and its variations were still raging and people were in no hurry to return to the labor market. In addition global supply chain issues meant that many companies could not return to full production due to lack of materials and components.
The enormous mis-match between very strong demand and little supply, as well as a 0,25% interest rate, could only result in one thing: inflation. Inflation had remained below 2% the whole time, but not anymore. In February 2021 inflation stood at just 1,70%, then soared throughout the year to 7%. When Russia invaded Ukraine in February 2022, even more upward pressure was added. Meanwhile the Federal Reserve kept the interest rate at 0,25%, saying in late 2021 that the spike in prices was just »transitory«. Finally realizing that it wasn't transitory at all, they started raising the interest rate in March 2022 by a modest 0,25% when inflation already stood at 8,50%. Realizing small interest rate increases would not bring inflation under control, the FED then raised it eight more consecutive times to currently 5,00% in what were the most aggressive interest rate hikes in US history (which also resulted in several US banks recently defaulting). Finally inflation spiked in June 2022 at 9,1%, the highest inflation since 1981(when the US was in the middle of its double recession). It has been on the decline since, currently standing at 6,0% and expected to decline further.
What we have here however, if history is any indication, is the recipe for a recession that is just around the corner. The main reason why analysts still believe that a recession may be avoided is the US labor market which, despite the high inflation and interest rate, reached its lowest unemployment rate in more than half a century at 3,4% in January, just two months ago. However climbing inflation and consequently climbing interest rates preceeded every recession of the past 50 years and recessions before that. It would be an exception and economically ilogical if it would not occur now.
A closer look at the labor market: active population and labor participation
Intrigued by the strong labor market numbers, I conducted a deeper analysis using the numbers of the US Bureau of Labor Statistics, going back as far as 1939.
At the end of 2019 the US active population stood at 153,5 million. This fell by a staggering 5 million by the end of Q2 2020 as a result of the pandemic. However by the end of 2022, that number has returned to 153,6 million.
The participation rate is the number of people ages 16 and older who are employed or actively seeking employment, compared to the total civilian working-age population. A lower participation rate attributes to a lower unemployment rate because working-age people who are not employed and not actively seeking employment are not considered unemployed.
There are many things that can be deduced from the historical data. For example the participation rate increased throughout the latter half of the 20th century, which was largely driven by the emancipation of women whose participation tripled. For the past 20 years the overall participation has been on a steady decline and stood at 63,3% just prior to the COVID lockdowns. This steady decline is largely attributed to the baby boomers generation reaching retirement age. People between the ages of 25 and 54 have consistently the highest participation rate at over 80%, while younger age groups had strong decreases, likely due to more people aiming for a higher education, thus delaying their participation on the labor market. Interestingly the youngest group's participation has been on the increase again for the past decade, which could be attributed to more job demand and higher wages in the traditional trades, as well as the determent of high education costs in the USA.
The essence though is that the moment the lockdowns were enacted the participation rate dropped from 63,3% in February to 60,1% in April 2020. While the decline may seem small, it effectively means that 5% or 1 out of every 20 people that were employed or actively seeking employment dropped out of the active workforce. This could have a huge impact on the employment rate, but of course we know that proportionally far more people lost their jobs while remaining in the active population – otherwise the unemployment rate would not have jumped from 3,4% to 14,7% over the same 2-month period. However, just as the unemployment rate dropped in the following years, the participation rate also largely recovered and stood at 62,4% again in January 2023, still a bit below the participation rate before the lockdowns, but not so much that it would have a material impact on the unemployment rate. In fact it's pretty much in line again with the negative participation rate trend of the past 2 decades.
A closer look at the labor market: sectors
Things become more interesting when we look at employment by sector. Since 1939 non-farm payrolls have grown 5-fold to 155 million, more or less proportionally in line with the growth of the US population. There are however clear shifts between segments and sectors. First off the goods-producing segment, which consists of the construction, manufacturing and natural resources/mining sectors, has lost significant weight in the total number of non-farm payrolls. Representing 37% of non-farm payrolls in 1939, the goods-producing segment now only still represents 14%. The manufacturing sector, the largest of the goods-producing segment, dropped from 30% to just 8% of the total non-farm payrolls. This is the result of automation, as well as manufacturing jobs being sent overseas to cheap labor countries. Mind you, manufacturing jobs still grew by 43% in terms of actual job numbers, it just didn't grew as fast as the services sectors did, hence losing weight relatively in the overall labor market.
The services segment consists of the sectors of Private Education and Health Services, Financial Activities, Information, Leisure and Hospitality, Professional and Business Services, Trade/Transportation/Utilities, Other Services, and Government Payrolls. Trade/Transportation/Utilities is the largest sector, representing 18,58% of all payrolls, but the Private Education and Health Services sector is the fastest growing, having grown 18-fold since 1939, and may in a few years overtake as the largest sector in absolute terms. Also the Professional and Business Services sector sector grows more rapidly and is gaining significant weight at currently 14,75%.
Perhaps surprisingly, the Information sector (which consists of IT services and media) grew well below average with 176% growth since 1939 and representing only 2% of the total non-farm payrolls. They represent some of the largest companies in the world in terms of market capitalization, but they certainly do not in terms of employment. Keep that in mind the next time you read about yet another IT giant cutting jobs.
But let's see how employment in all these sectors was impacted during and after the COVID lock-downs. The chart below shows the growth of payrolls of each sector from January 2019 until February 2023.
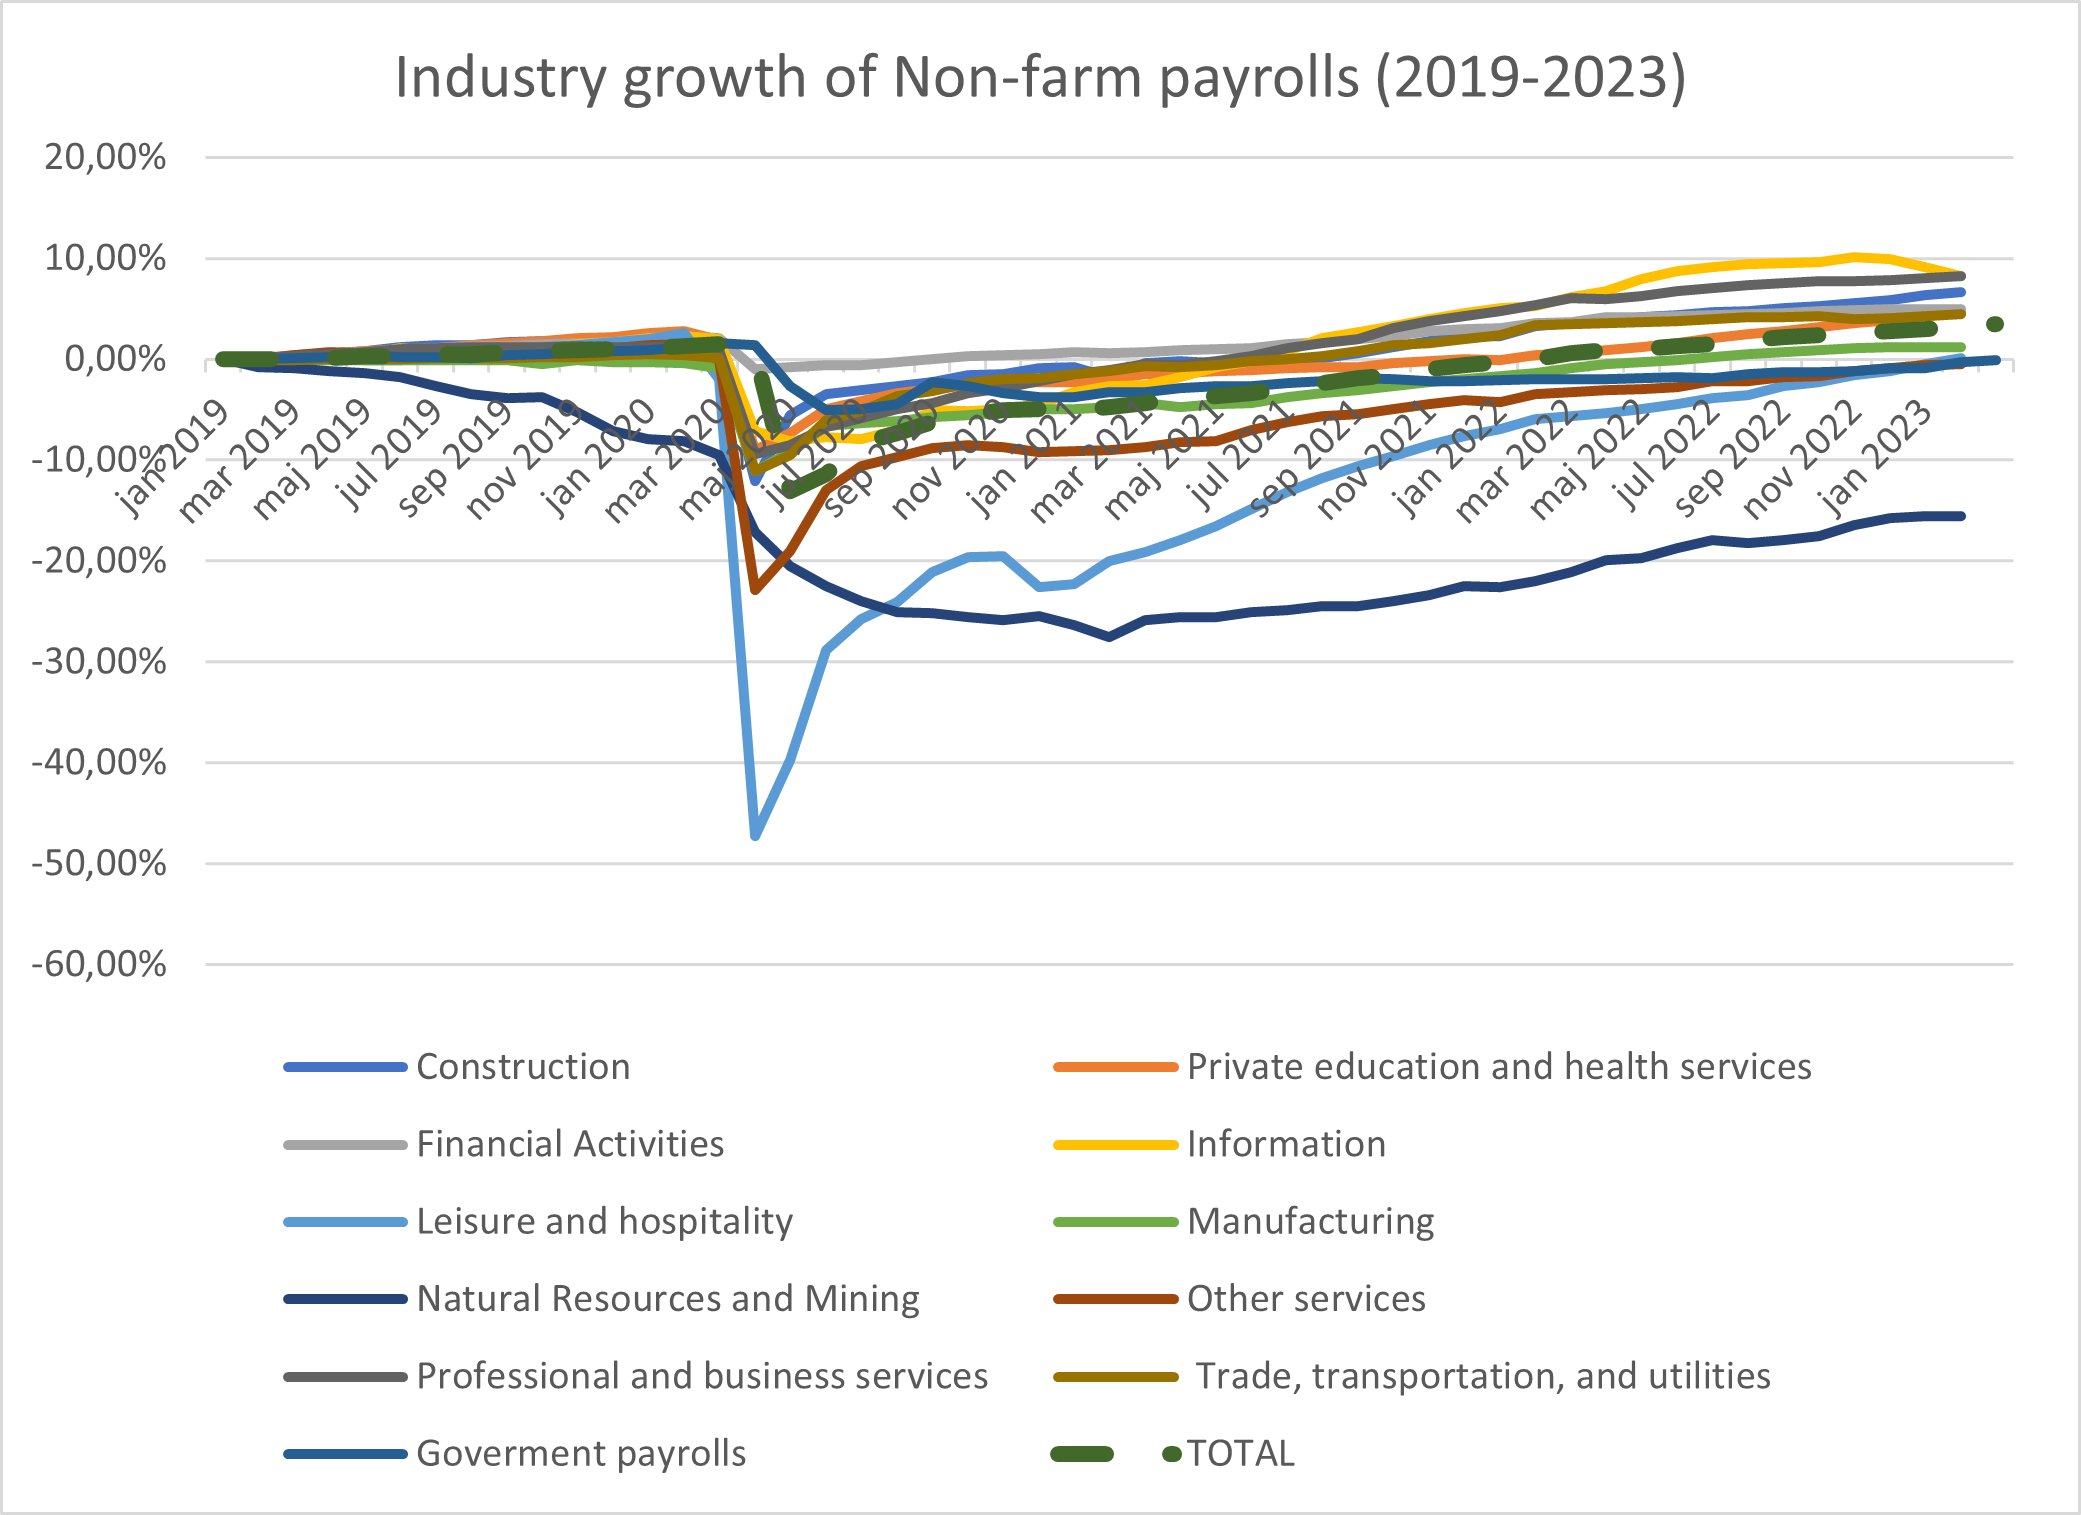
Total non-farm payrolls dropped by 13% in April 2020 but managed to recover entirely and add 3,3% of payrolls by January 2023. This strongly supports the current unemployment rate being as low as it is.
It's clear and logical which sector took the most damage during the lock-downs – leisure and hospitality slashed nearly 50% of its jobs in April 2020 as people were ordered to stay home and restaurants, bars and other other leisure and traveling business were shut down. However, even this sector managed to recover the lost jobs entirely by now. Only the mining sector has not recovered yet, but only represents 0,4% of the non-farm payrolls. Some sectors, like finance and government payrolls were barely affected by the lockdowns.
While this looks good, notice how some sectors appear to be taking a downturn these past few months. In absolute numbers the non-farm payrolls are still increasing month after month, but the number of jobs added are dwindling and are essentially carried by just two sectors: the Education and Health Services sector (with the highest growth rate historically), and the Leisure and Hospitality sector (which recovered from the strongest hit as a result of the lockdowns). Of the private non-farm payrolls, these two sectors contributed two thirds of all jobs added in January 2023. However, with 108.000 jobs added in January, the Leisure and Hospitality sector is far short of the 148.000 jobs it added monthly on average over the past 2 years and it is doubtful it will sustain adding this many jobs throughout 2023. Meanwhile the financial activities sector, manufacturing sector and particularly the information sector are losing payrolls. Over the past 2 years they added a combined 66.000 payrolls per month on average. The general downtrend is clear and the pressure to hold up the entire US labor market basically rests entirely on the shoulders of the Private education and health services sector.
Canary in the coal mine
The final piece of the puzzle is the actual unemployment rate by sector. Just because a sector is adding payrolls does not mean the sector's unemployment rate is decreasing. If more people enter the active population compared to the number of jobs becoming available then unemployment will rise. This leads to the disturbing chart below, which illustrates the time of the low US unemployment rate has passed and a reversal is now as good as certain.
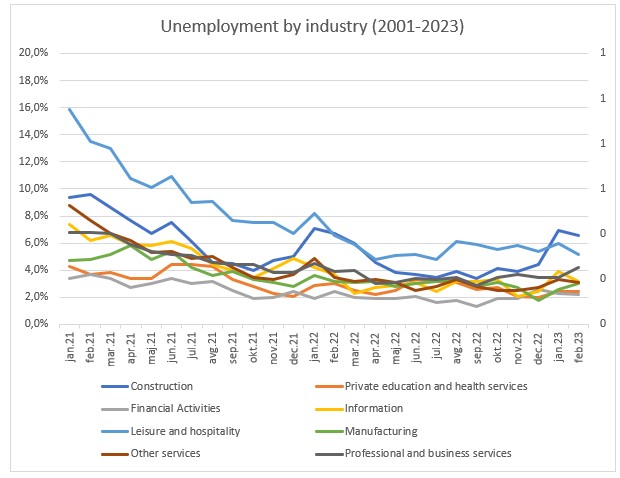
The chart, which starts in January 2021, shows lowering unemployment rates across all sectors. Particularly the leisure and hospitality sector has recovered tremendously due to the reopenings. Notice also that the financial sector and private education and health services sector hold the lowest unemployment rates at just 2,2% and 2,4% respectively.
However, despite the overall unemployment rate being at just 3,4% in January 2023, several sectors are witnessing climbing unemployment rates already since the last quarter of 2022. The finance sector unemployment climbed from 1,3% to 2,2%. Manufacturing unemployment went from 2,7% to 3%, professional and business services unemployment went from 2,9% to 4,2%.
Once again the education and health services sector is the one holding the overall unemployment rate down. And while the drop of the unemployment rate of the leisure and hospitality sector surely helped, it now appears to be stagnated between 5% and 6%.
The largest concern however is the construction sector where the unemployment rate climbed from 3,4% in September 2022 to 6,6% in January 2023. As the FED dramatically increased the interest rate throughout 2022, loans become much more expensive. People and businesses are discouraged to initiate the construction of a new building under such financing conditions. Hence the construction sector has historically been the sector to suffer first from climbing interest rates, and is considered the proverbial »canary in the coal mine« as it indicates an upcoming recession before other sectors do. And given the record interest rate increases so far as well as the still-elevated inflation, folks, I believe this canary just went to a better place.
So now what?
The upcoming recession is all but certain. In my view all the factors are in place: inflation already spiked in June last year. The FED finally responded with aggressive interest rate increases which I believe will also soon come to a halt as I expect it will exceed inflation by the summer of this year. And unemployment reached in my opinion its lowest point two months ago – it will go up from here on and already did in February when it notched up from 3,4% to 3,6%.
When the recession will hit its deepest point is harder to point out but, based on the timelines of all the recessions of the past 50 years, I suspect it will occur around the first quarter of 2024. As mentioned earlier, the unemployment rate is the last one to spike and, again based on historical data, I project that to occur by late 2024.
The stock market already has the recession partially priced in. Unlike monthly or quarterly macro economic data that is released after the fact, the stock market moves based on future expectations. So when inflation got nearly out of control and the FED started aggressively raising the interest rate last year, stocks were already losing value in anticipation of a potential recession. That does not mean the market has hit its bottom yet though. Historically the market hits a low right around the time when economic growth hits its low point which, again, I estimate to occur around Q1 2024.
Likewise, the market should already recover even when the unemployment rate is still on the rise as optimism grows and the economy cycle passes the trough and enters the expansion stage again. Until then I largely avoid growth stocks such as the technology sector and cyclical stocks such as car manufacturers, and hold on to defensive stocks, meaning companies with low debt, steady cashflow and attractive valuations, primarily in the sectors of consumer staples, pharmaceuticals and such.
Rudy Marchant
Fund manager Primorski skladi